Modern businesses depend on reliable data systems. Analytics dashboards, operational reports, machine learning models, and business decisions all rely on data arriving correctly, on time, and in a usable format.
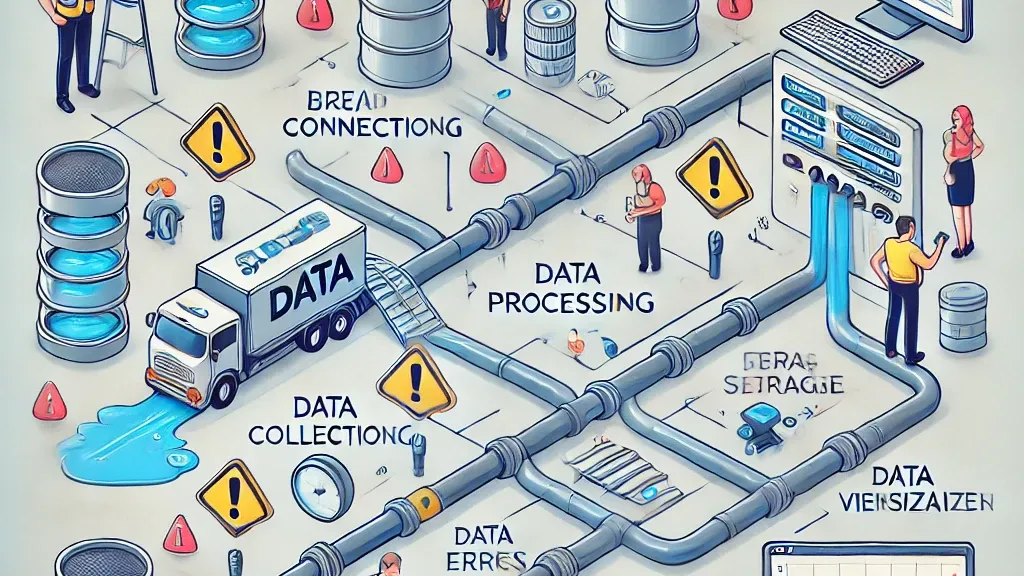
But data systems are constantly changing. New sources are added, pipelines become more complex, and workloads continue to grow. Without proper visibility, small issues can quickly become major problems.
A dashboard showing incorrect numbers, a delayed report, or a failed pipeline can impact business decisions and reduce trust in analytics.
This is where data observability becomes essential.
Observability helps teams understand what is happening inside their data systems, identify problems early, and maintain reliable analytics without waiting for users to report issues.
What Is Data Observability?
Data observability is the practice of monitoring, understanding, and improving the health of data systems.
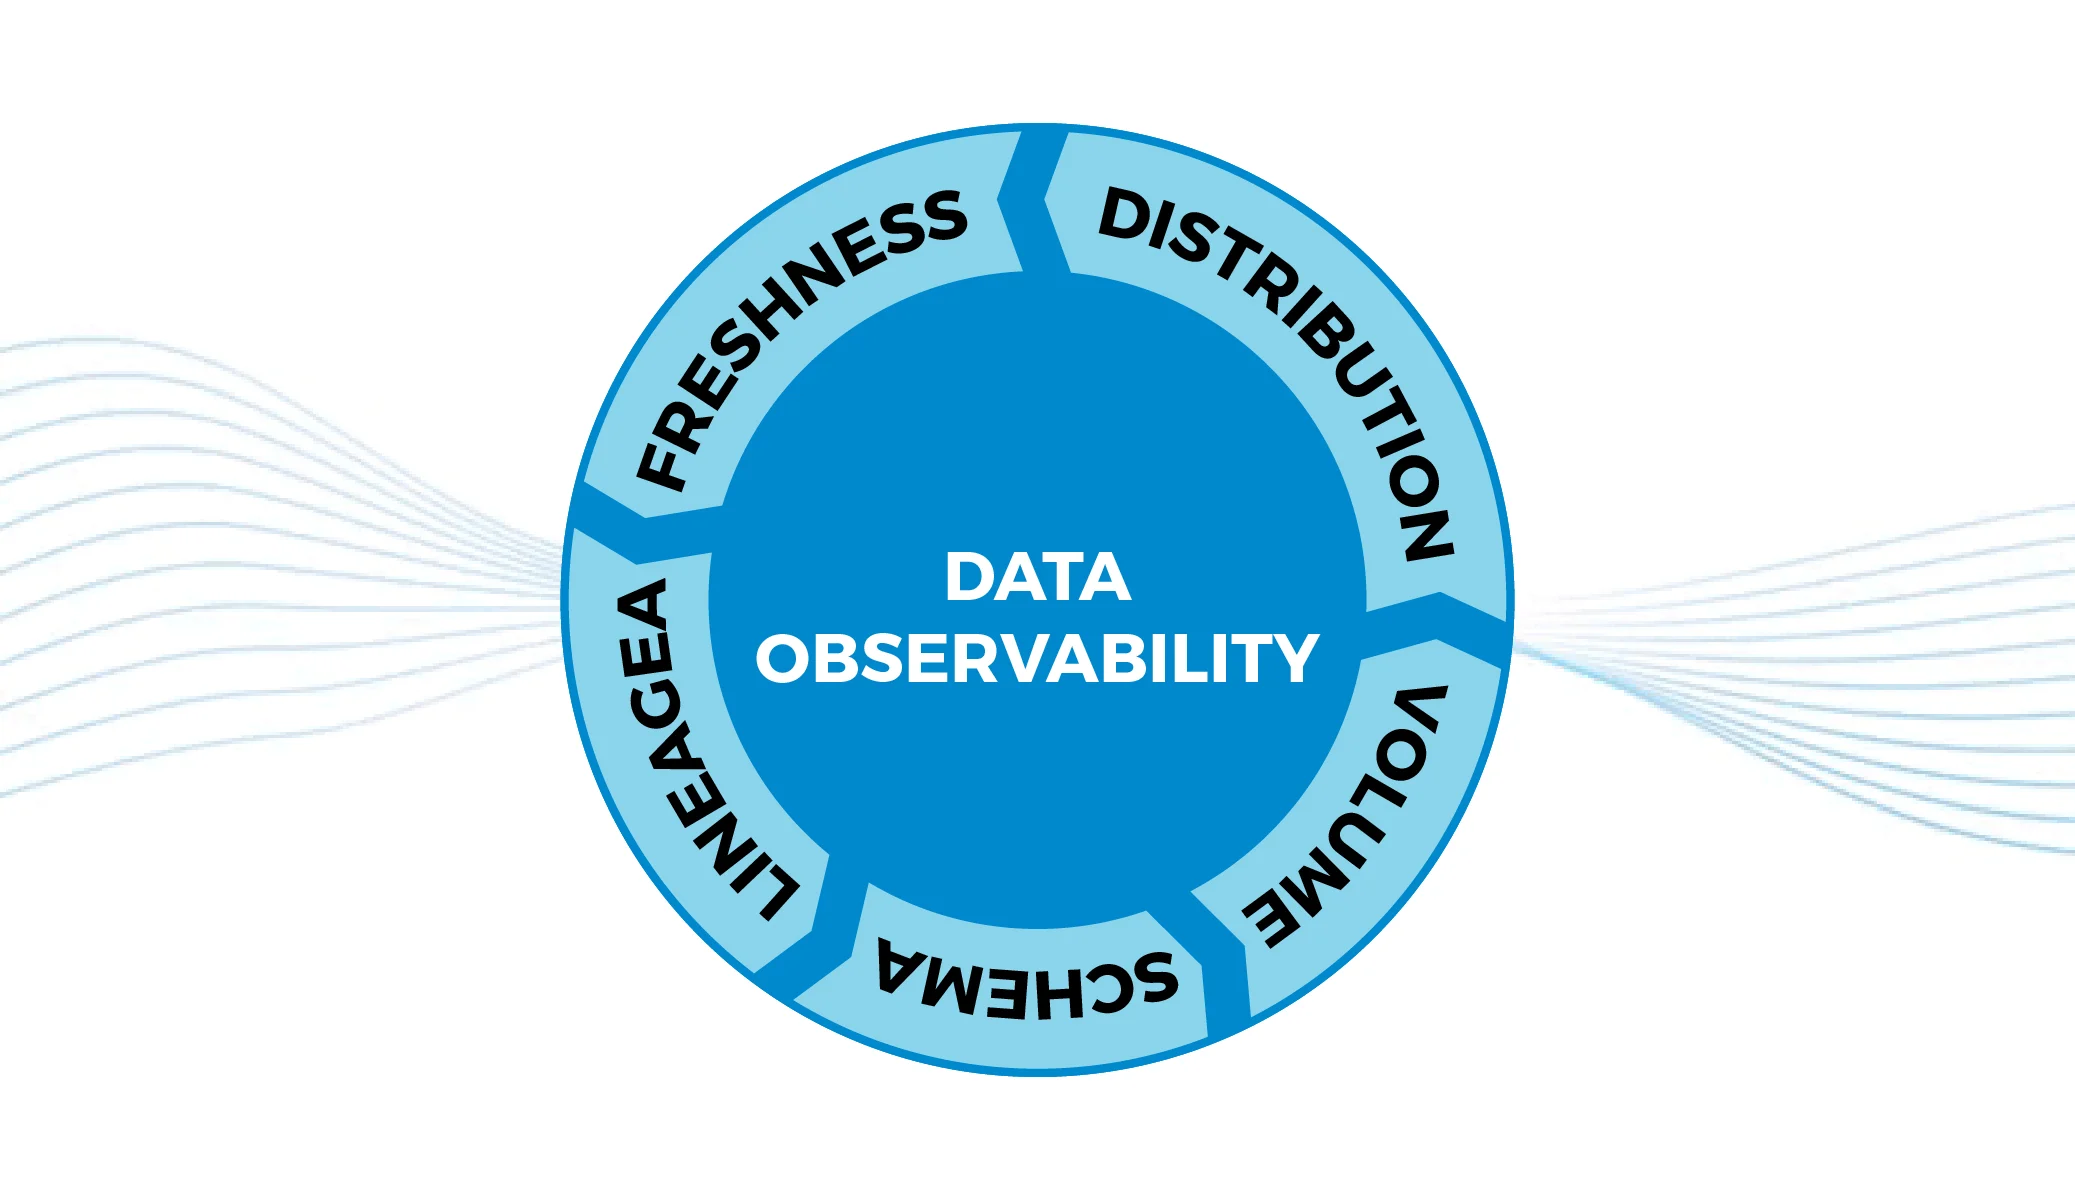
It provides visibility into important aspects of data operations, including:
- Data quality
- Pipeline performance
- Data freshness
- System reliability
- Infrastructure health
- Unexpected changes
Traditional monitoring often focuses on whether a system is running. Data observability goes further by asking whether the data itself is accurate, complete, and trustworthy.
A pipeline can successfully complete while still producing incorrect results. Observability helps teams detect these hidden problems.
Why Data Observability Matters
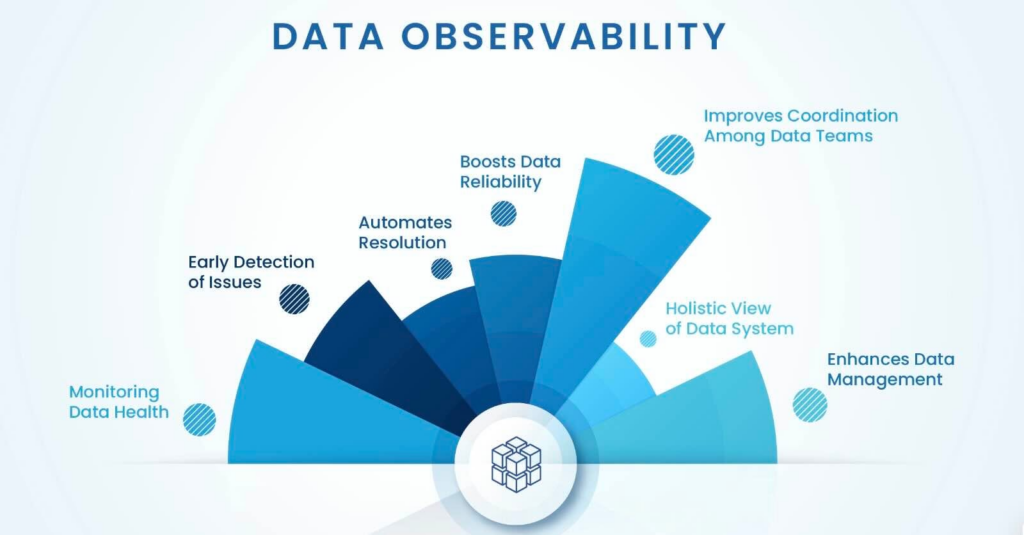
As organizations depend more heavily on analytics, the cost of unreliable data increases.
Poor data reliability can lead to:
- Incorrect business decisions
- Loss of confidence in analytics
- Delayed reporting
- Failed automated processes
- Increased engineering workload
Without observability, teams often discover problems only when someone notices unexpected results.
This creates a reactive approach where engineers spend time investigating issues after they have already affected users.
A proactive observability strategy allows teams to detect and resolve problems earlier.
The Core Areas of Data Observability
Effective data observability focuses on several important dimensions of system health.
1. Monitoring Data Quality
Data quality is one of the most important parts of reliable analytics.
Even if pipelines run successfully, the output may still contain problems.
Common data quality issues include:
- Missing values
- Incorrect formats
- Duplicate records
- Unexpected changes
- Incomplete datasets
- Invalid business logic
Monitoring data quality helps teams identify issues before they reach analysts and decision-makers.
Important Data Quality Checks
Useful checks include:
Completeness
Are all expected records and fields present?
Accuracy
Does the data represent real-world events correctly?
Consistency
Do different systems produce compatible information?
Validity
Does the data follow expected rules and formats?
Uniqueness
Are duplicate records affecting analysis?
Automated quality checks create confidence that analytics are based on reliable information.
2. Tracking Pipeline Health
Data pipelines are the foundation of analytics systems.
A pipeline failure can prevent critical information from reaching users.
Pipeline monitoring should track:
- Successful and failed runs
- Processing times
- Error frequency
- Dependency failures
- Resource usage
Important questions include:
- Did the pipeline complete successfully?
- Did it finish within the expected timeframe?
- Did the data arrive as expected?
- Did any unexpected errors occur?
Visibility into pipeline health allows teams to respond quickly when problems appear.
3. Measuring Data Freshness
Freshness refers to how recently data has been updated.
For many analytics use cases, outdated information can be just as problematic as incorrect information.
Examples:
- A sales dashboard showing yesterday’s numbers
- A monitoring system missing recent events
- A recommendation system using old customer behavior
Freshness monitoring helps teams understand whether data is available when users expect it.
Organizations should define freshness expectations based on business needs.
For example:
- Real-time systems may require updates within seconds.
- Operational reports may require hourly updates.
- Strategic reports may only need daily updates.
4. Monitoring Performance
Data systems must remain efficient as workloads grow.
Performance monitoring helps teams identify issues such as:
- Slow queries
- Long-running pipelines
- Increasing processing costs
- Resource bottlenecks
Performance metrics may include:
- Query execution time
- Pipeline duration
- Storage growth
- Compute usage
- System response times
Performance monitoring ensures analytics systems continue meeting user expectations.
5. Understanding Reliability
Reliability measures how consistently a data system performs over time.
A reliable system should provide:
- Predictable availability
- Stable performance
- Consistent results
- Fast recovery from failures
Reliability monitoring helps teams identify patterns and prevent repeated problems.
Common Causes of Data System Failures
Understanding common failure points helps organizations build better monitoring strategies.
Changing Data Sources
Applications and external systems frequently change.
A renamed field, modified format, or removed attribute can break downstream processes.
Pipeline Dependencies
Many pipelines depend on other systems. A failure upstream can create problems throughout the data ecosystem.
Growing Data Volumes
As datasets increase, processes that once worked efficiently may become slower or more expensive.
Poor Data Quality Controls
Without automated checks, incorrect data may continue flowing through systems unnoticed.
Manual Processes
Manual steps create opportunities for delays and human error.
Observability helps identify these problems before they affect users.
Building an Effective Data Observability Strategy
Creating observability requires more than adding monitoring tools. It requires a thoughtful approach to understanding system behavior.
Establish Clear Expectations
Teams should define what healthy data looks like.
Important expectations include:
- Expected delivery times
- Acceptable error rates
- Required data completeness
- Performance targets
Clear standards make it easier to identify problems.
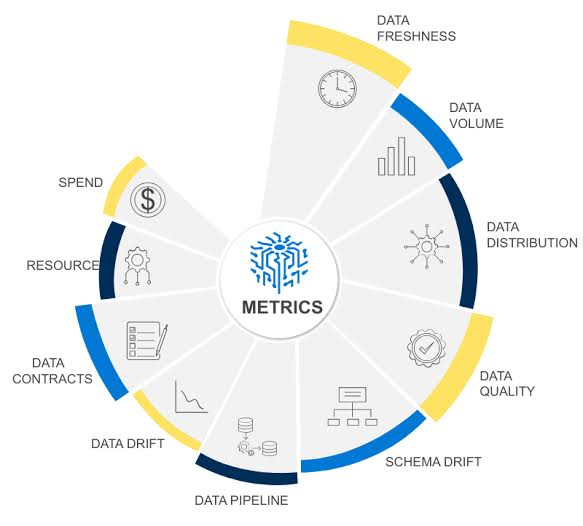
Monitor the Right Metrics
Too much monitoring can create unnecessary noise.
Teams should focus on metrics that provide meaningful insight.
Examples include:
- Pipeline success rates
- Data freshness
- Quality failures
- Query performance
- Resource consumption
Effective monitoring helps teams focus on important issues.
Create Automated Alerts
Alerts should notify teams when something requires attention.
Useful alerts include:
- Failed pipelines
- Missing data
- Unexpected volume changes
- Delayed processing
- Performance degradation
Good alerts help engineers respond before users experience problems.
Connect Technical and Business Impact
Not every technical issue has the same importance.
A failed internal test dataset may have limited impact. A failed customer reporting pipeline may require immediate attention.
Observability should help teams prioritize based on business impact.
Avoiding Common Observability Mistakes
Organizations often struggle with observability because of a few common mistakes.
Monitoring Only Infrastructure
A system can be running while producing unreliable data.
Monitoring should include data health, not only servers and services.
Creating Too Many Alerts
Excessive notifications create alert fatigue.
Teams should prioritize meaningful signals.
Adding Monitoring Too Late
Observability is most effective when included during system design.
Ignoring Documentation
Teams need clear information about expected behavior to identify unusual changes.
A Practical Implementation Roadmap
Organizations can introduce observability gradually.
A practical approach includes:
- Identify critical data assets.
- Determine which datasets and pipelines matter most.
- Define reliability expectations.
- Establish freshness, quality, and performance goals.
- Add automated monitoring.
- Track important system and data metrics.
- Create meaningful alerts.
- Focus on problems that require action.
- Review patterns regularly.
- Use observations to improve architecture and processes.
- Expand coverage over time.
- Apply observability practices across the data ecosystem.
Turning Data Reliability Into a Competitive Advantage
Reliable data systems create more than technical stability. They build trust across an organization.
When teams know that their data is accurate and available, they can make decisions faster and operate with greater confidence.
Observability changes data management from a reactive process into a proactive one. Instead of discovering problems after users are affected, teams can identify risks early and resolve issues before they impact business operations.
The strongest analytics platforms are not just fast or scalable. They are observable, predictable, and trustworthy.
By monitoring data quality, pipeline health, performance, and reliability, organizations can create data systems that support confident decision-making at every level.